>Home>Debugging the STM32F103 with an ST LINK/V2 and OpenOCD
Debugging the STM32F103 with an ST LINK/V2 and OpenOCD
Published 10/3/2017
Debugging is a very useful tool when working with Microcontrollers. I decided to order an ST-Link/V2, which is available for a few Euros (I paid roughly 6 EUR for mine). This device supports the SWD protocol for STM32 chips, which allows the chip to be programmed and debugged from 4 pins.
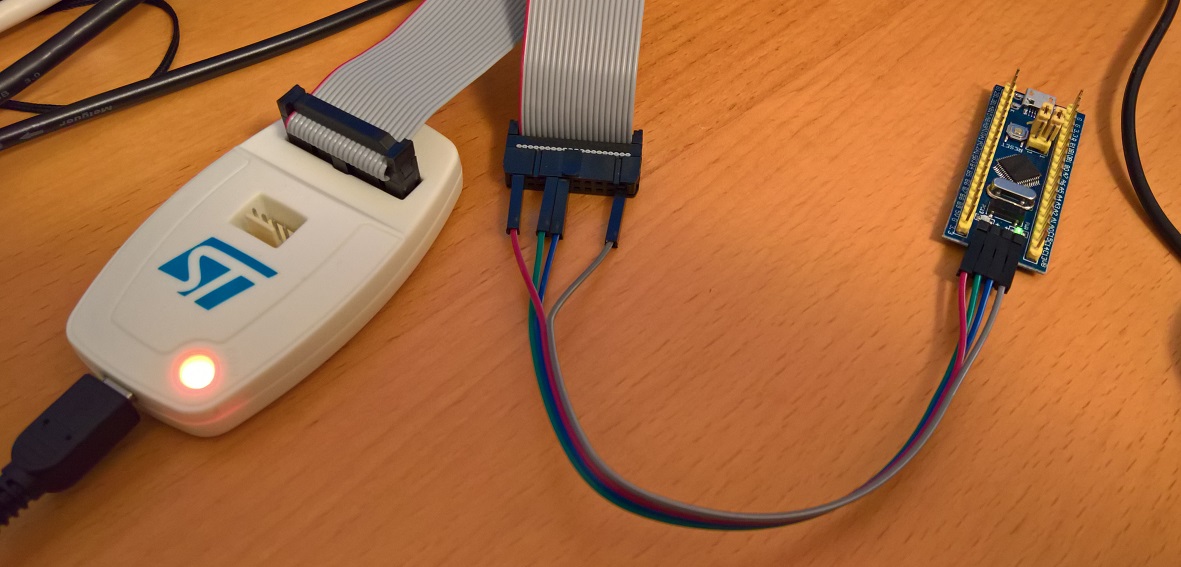
The first step is to connect the 4 pins. In the following picture, red is the target device voltage, grey is GND, green is IO and blue is CLK. Note that the device still needs external power, which I supply via the micro USB cable (not shown).
OpenOCD is an open source on chip debugger which can be downloaded from http://openocd.org/. It takes a client server approach, and the first step is to start the daemon which connects to the target device. This can be done using the following command, where -s tells openocd where to search for scripts and we tell it to use the stlink-v2 config as well as the stm32f1x config.
.\openocd.exe -s ..\scripts\ -f interface\stlink-v2.cfg -f target\stm32f1x.cfg
Once the OpenOCD daemon is started, we need to use telnet to connect to the device. For this we can connect to the local machine on port 4444, and can directly start issuing commands to the device.
telnet localhost 4444
With OpenOCD connected we can start using various commands. The first thing we can do is reset the device and tell it to break on the first command. This can be done by calling "reset halt" as follows:
> reset halttarget halted due to debug-request, current mode: ThreadxPSR: 0x01000000 pc: 0x00000152 msp: 0x20005000
As can be seen, our program counter (pc) is at 0x152, so if we want to see the assembler at that point, we can ask OpenOCD to disassemble it for us, using the arm disassemble command, giving it the address as well as the number of instructions to disassemble.
> arm disassemble 0x152 200x00000152 0xe92d4ff0 PUSH.W {r4, r5, r6, r7, r8, r9, r10, r11, r14}0x00000156 0xb083 SUB SP, #0xc0x00000158 0xf2400004 MOVW r0, #4 ; 0x0040x0000015c 0xf2400108 MOVW r1, #8 ; 0x0080x00000160 0xf2c20000 MOVT r0, #8192 ; 0x20000x00000164 0xf2c20100 MOVT r1, #8192 ; 0x20000x00000168 0x1a09 SUBS r1, r1, r00x0000016a 0x2901 CMP r1, #0x010x0000016c 0xbfa8 IT GE0x0000016e 0xf000fb1c BL 0x000007aa0x00000172 0xf2400000 MOVW r0, #0 ; 0000x00000176 0xf2400104 MOVW r1, #4 ; 0x0040x0000017a 0xf2c20000 MOVT r0, #8192 ; 0x20000x0000017e 0xf2c20100 MOVT r1, #8192 ; 0x20000x00000182 0x1a0a SUBS r2, r1, r00x00000184 0x2a01 CMP r2, #0x010x00000186 0xdb05 BLT 0x000001940x00000188 0xf24071f8 MOVW r1, #2040 ; 0x7f80x0000018c 0xf2c00100 MOVT r1, #0 ; 00000x00000190 0xf000fb00 BL 0x00000794
We can also use the debugger to dump raw memory, using the mdb command, we tell it where and how much memory to dump:
> mdb 0x0 640x00000000: 00 50 00 20 53 01 00 00 51 01 00 00 51 01 00 00 51 01 00 00 51 01 00 00 51 01 00 00 00 00 00 000x00000020: 51 01 00 00 51 01 00 00 00 00 00 00 51 01 00 00 51 01 00 00 51 01 00 00 51 01 00 00 51 01 00 00
Setting breakpoints can be done using the bp commands, and they can be removed using the rbp command, as in the following examples:
> bp 0x7aa 2breakpoint set at 0x000007aa> rbp 0x7aa
Otherwise there is the resume command, to continue execution in halted state, as well as the step command, to only execute a single opcode.
Another nice command is the reg command, which dumps all registers:
> reg===== arm v7m registers(0) r0 (/32): 0x20000004(1) r1 (/32): 0x00000004(2) r2 (/32): 0xD4F014C0(3) r3 (/32): 0x04A82F37(4) r4 (/32): 0x20000004(5) r5 (/32): 0xFFCFFEDD(6) r6 (/32): 0x0C06C5A6(7) r7 (/32): 0x390A2280(8) r8 (/32): 0x9A9F8FD8(9) r9 (/32): 0xFFDF5B9D(10) r10 (/32): 0xD4368C54(11) r11 (/32): 0x680C1352(12) r12 (/32): 0x7DBEF177(13) sp (/32): 0x20005000(14) lr (/32): 0xFFFFFFFF(15) pc (/32): 0x00000152(16) xPSR (/32): 0x01000000(17) msp (/32): 0x20005000(18) psp (/32): 0xC4E16220(19) primask (/1): 0x00(20) basepri (/8): 0x00(21) faultmask (/1): 0x00(22) control (/2): 0x00===== Cortex-M DWT register(23) dwt_ctrl (/32)(24) dwt_cyccnt (/32)(25) dwt_0_comp (/32)(26) dwt_0_mask (/4)(27) dwt_0_function (/32)(28) dwt_1_comp (/32)(29) dwt_1_mask (/4)(30) dwt_1_function (/32)(31) dwt_2_comp (/32)(32) dwt_2_mask (/4)(33) dwt_2_function (/32)(34) dwt_3_comp (/32)(35) dwt_3_mask (/4)(36) dwt_3_function (/32)
The problem I was facing in http://localhost:8089/Home/6-rust-stm-handling-static-variables with my rust code crashing, seems to be that the code produces the following code for the memory initialization routine:
> arm disassemble 0x7aa 200x000007aa 0xb510 PUSH {r4, r14}0x000007ac 0x4604 MOV r4, r00x000007ae 0x2901 CMP r1, #0x010x000007b0 0xbfa4 ITE GE0x000007b2 0x4620 MOV r0, r40x000007b4 0xf7fffff9 BL 0x000007aa
This code essentially ends up in an infinite loop, because the r1 register is never changed. Each time it loops it jumps to 0x7aa, which contains a push command causing the stack pointer to decrease. This continues untill the microcontroller overwrites memory which it is not allowed to write, causing it to land in a fault interrupt. I'm still not entirely sure why the compiler produces this code however.
This can be confirmed by running and then halting the microcontroller:
> resume> halttarget halted due to debug-request, current mode: Handler HardFaultxPSR: 0x21000003 pc: 0x00000150 msp: 0x1fffffe0